
Amazon advertising · 11 minute read
Amazon TACoS benchmarks: what 14 accounts we've managed actually ran (156 months of data)
Most published TACoS benchmarks give 10% to 15% as the normal range, and the ones we read don't say which accounts the figure came from. So we measured our own: ad spend divided by total sales, month by month, in every account where we hold the monthly figures. Here is what 156 account-months show, how we worked it out, and what we threw away.

By Robert Prime
CEO and co-founder

Reviewed by Stephen Harrison
Account Director
- Published
- Last reviewed
- Sources
- 2 primary and labelled
Cover designed for Mr. Prime.
The short answer
Key takeaways
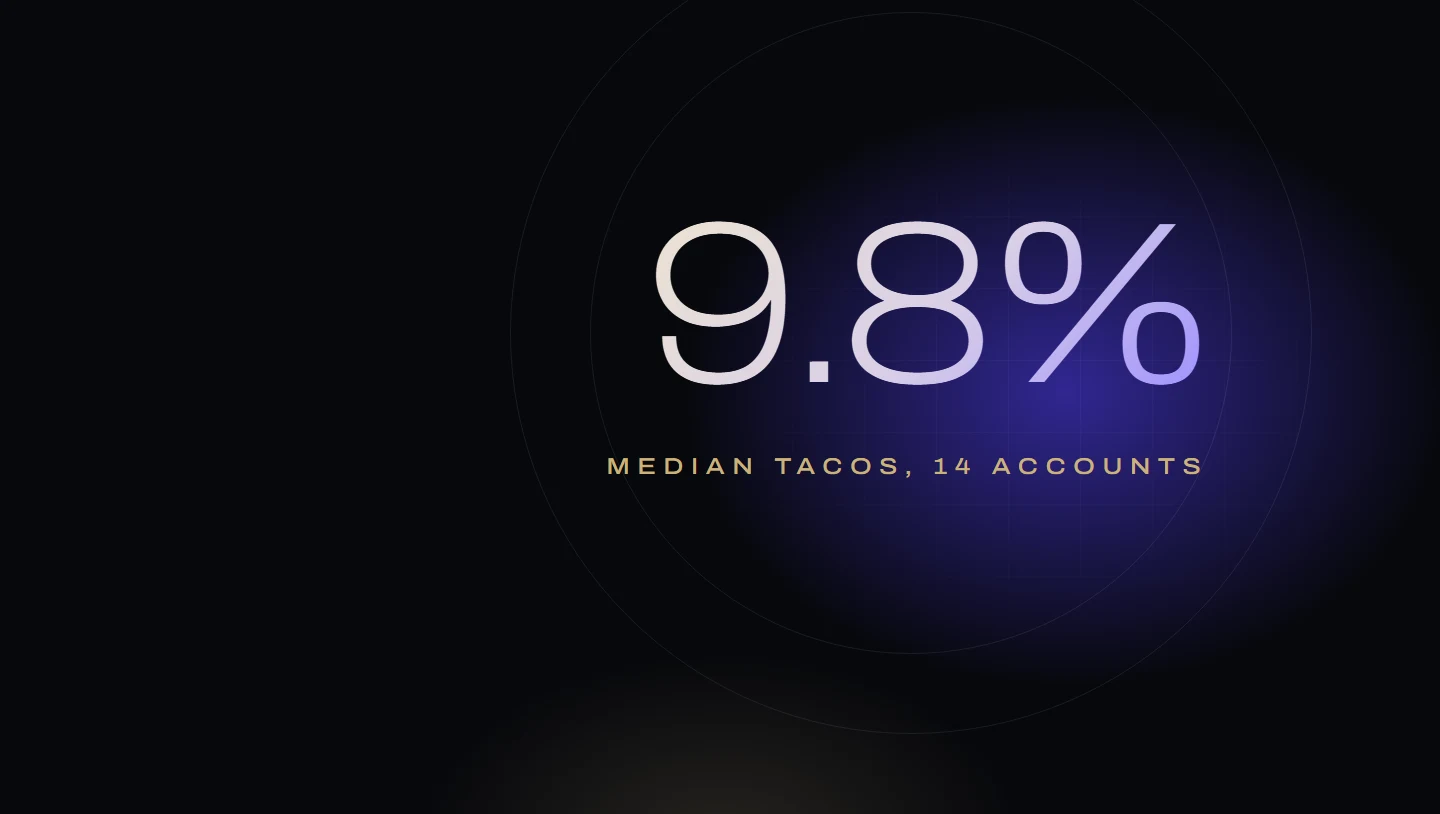
- The median account ran 9.8%. The middle half ran 7.4% to 17.7%, and the highest and lowest were far apart: 2.6% and 43.1%.
- Against the published tables, 11 of our 14 accounts sat under the 20% level flagged as a concern: seven under 10%, three at 10% to 15%, and one at 15% to 20%.
- The three accounts above 20% were launches. We don’t treat that as acceptable long term. Leave them out and the median is 8.3%, with accounts running from 2.6% to 18.9%.
- A good TACoS depends on the business. As a rough guide, electricals run lower because margins are thin, sports products sit around the middle, and supplements run higher because of repeat buying and larger order values. Profit decides, not the benchmark.
- Low and high TACoS accounts differed on both parts of the sum, by about the same amount: ads were credited with about a third of sales against over half, and ACoS was about 21% against 38%.
- Most accounts moved about a point a month. Accounts above 15% moved 2.4 to 16 points, so a single month says little about them.
- November and December showed no clear pattern. Across the 7 accounts with a year or more of data, TACoS was lower in 4 and higher in 3, and in 6 of the 7 the gap was under 2 points.
By the numbers
- 9.8%
- Median TACoS across 14 accounts we've managed, Nov 2024 to Apr 2026 (our data)
- 7.4–17.7%
- The middle half of accounts: the range from the 25th to the 75th percentile (our data)
- 11 of 14
- Accounts whose median sat under the 20% level published benchmarks flag as a concern
- 1.2 pts
- Typical change in an account's TACoS from one month to the next (median across accounts)
From Robert Prime and the Mr. Prime team, who manage Amazon advertising for founder-led UK and European brands: £2.5m of ad spend across our client accounts in the last 12 months. Every figure here comes from the monthly sheets we keep for the accounts we run.
Search for a TACoS benchmark and the same band comes back: 10% to 15% is healthy. One benchmark table puts the “2026 Platform Average” for TACoS at “10% to 15%”, with under 10% as outperforming and over 20% as needing attention1. Another says “A healthy account-level TACOS is 10-15% of total Amazon revenue"2, and explains that it took the band from the first page and blended its other figures from several reports, “not a single survey"2. Neither page says how many accounts, which marketplaces or which months the TACoS band was measured on.
We hold the monthly sales and advertising figures for the accounts we’ve managed, so we measured it. This page sets out what we found, how we worked it out and what we left out, so you can judge it for yourself. If you want to set a target for your own brand rather than compare against other people’s, start with our guide to a good TACoS; it shows how to work out a ceiling from your margin.
What we measured
TACoS is ad spend divided by total sales. For each account and each month we took two figures from the sheet we keep for that account:
- Ad spend, from Amazon Ads.
- Ordered Product Sales, the total sales figure in Seller Central’s Business Reports, which counts every sale, whether or not an ad was clicked.
How we calculated every figure on this page
TACoS = ad spend ÷ Ordered Product Sales
We recalculated it ourselves from the raw ad spend and sales figures for every month.
That gave 14 accounts and 156 account-months, between November 2024 and April 2026. Accounts are in the sample for between 4 and 17 months, depending on when we started keeping the sheet and how long we ran the account. The sheets for four accounts stop before September 2025, and three of those four are the three highest figures here: those three were launches, on short stretches of data. Two sheets show their figures in dollars; TACoS is a ratio, so currency doesn’t change it. One sheet labels sales in pounds and its ad figures in dollars; we treated that as a labelling slip, because the sheet’s own TACoS sums treat them as one currency.
We worked out each account’s median month, so that one unusual month can’t drag an account’s figure, and then compared the 14 accounts with each other. Every account counts once, whatever its size.
What we left out, and why
A script applied the same rules to every account and printed each month it removed. It took out 22 account-months for five reasons:
- Months with no ad spend recorded (12). Nine were one account’s months where the sheet records no ad spend. TACoS is meaningless without ads.
- Months where ad spend was under a tenth of the account’s usual level (3). Ads were effectively paused, so the month says nothing about running ads.
- A month whose sales figure was clearly wrong (1). Sales divided by units gave an average price of about a fifth of that account’s usual price.
- Months below £1,000 of sales, or from an account left with fewer than four usable months (5). That removed one small account entirely.
- A month whose ad figures were an exact repeat of the month before (1). Ad spend and ad sales matched to the penny, which points to a copying slip.
We also left out four sheets that weren’t usable: one that was an exact copy of another account’s sheet, one second copy of an account that disagreed with its main sheet, and two that were empty.
The result: a median of 9.8%, and a wide spread
| TACoS | |
|---|---|
| Lowest account | 2.6% |
| 25th percentile | 7.4% |
| Median account | 9.8% |
| 75th percentile | 17.7% |
| Highest account | 43.1% |
Seven of the 14 accounts ran under 10%, three ran between 10% and 15%, one ran between 15% and 20%, and three ran above 20%. Seven accounts sit in the range the published tables label outperforming, three in the range labelled average, and three above the 20% level flagged as a concern12. So most of our accounts were not in the “average” range, and most of those outside it were below it.
The three accounts above 20% were launches. A launch buys its first sales, reviews and rank, so ads cost far more than the product can carry for long. We treat that as a temporary phase with a budget and an end date, not as an acceptable level long term. Leave those three out and the median falls from 9.8% to 8.3%, the middle half runs 6.1% to 11.5%, and accounts run from 2.6% to 18.9%.
What separates a low TACoS from a high one
TACoS can be split into two parts: how efficient the ads are, and how much of the business runs through them.
The two parts of TACoS
TACoS = ACoS × ad share of sales
Ad share = sales Amazon credits to ads ÷ total sales. We could measure it in every account, because our sheets also record ad-attributed sales.
Grouping the accounts by their median TACoS:
| Group | Accounts | Ad share of sales (median, range) | ACoS (median, range) | Typical month-to-month change |
|---|---|---|---|---|
| Under 10% | 7 | 32% (20–42%) | 21% (13–28%) | 1.0 point |
| 10% to 15% | 3 | 47% (46–66%) | 23% (21–31%) | 1.2 points |
| Over 15% | 4 | 58% (56–69%) | 38% (33–77%) | 5.8 points |
The two parts differ by about the same amount. Between the low group and the high group, the median ad share is about 1.8 times higher (32% to 58%) and so is the median ACoS (21% to 38%). The pattern isn’t the same all the way up: ad share rises through all three groups (32%, 47%, 58%), while ACoS is similar in the two lower groups (21% and 23%) and only stands out above 15%. Fourteen accounts can’t show what caused the difference. In our experience, ad share falls as rank, reviews and repeat buying grow, and ACoS rises with click prices and weak listings, but that is our reading, not something this data measures.
We don’t publish a TACoS figure by category, because fourteen accounts is too few to split by category honestly.
Why a good TACoS depends on the business
These 14 accounts can’t give you a figure for your category, but the type of business changes what you can afford. In our experience, three things matter most:
- Margin. The more of each sale is left after costs, the more you can spend on ads and still make a profit. Electricals tend to run on thinner margins, so they need a lower TACoS.
- Repeat buying. If customers come back without another ad, the first sale can cost more, because it isn’t the only sale. That is one reason supplements can carry a higher TACoS.
- Order value. A larger order leaves more pounds to pay for each click, even at the same percentage margin.
This is the rough guide we use in our Profit X-Ray for a product past its launch. It is drawn from published agency ranges and checked against the accounts we’ve managed. It isn’t an Amazon figure, and it isn’t measured from the 14 accounts above.
| Type of business | Rough TACoS once established | Why |
|---|---|---|
| Electricals and electronics | 6% to 10% | Thinner margins, so less room for ads |
| Sports and fitness | 9% to 15% | Around the middle |
| Supplements and vitamins | 12% to 18% | Repeat buying and larger order values can pay back a higher cost |
One published guide’s table puts electronics at 7-11% at maturity, health and household at 12-18% and beauty at 14-20% (its summary gives 7-13% for electronics and 14-20% for supplements and beauty), and says launches can run 25-40%, sometimes up to 50%, in the first one to three months2.
The same TACoS can leave room to spend more in one business and be too high in another:
So use the tables on this page to see whether your number is unusual, not whether it is good. Our guide to a good TACoS shows how to set your own ceiling.
How much TACoS moves from month to month
For each account we measured how far TACoS moved from one month to the next, and took the median.
- Nine of the 14 accounts moved by less than 1.5 points a month. For them, a two-point jump in one month is worth looking into.
- The four accounts above 15% moved by 2.4 to 16 points. One month on its own told us very little about them; three months did.
If your TACoS is above 15%, track a rolling three-month figure rather than reacting to each month.
What happens in November and December
We compared November and December with the other months, using only the 7 accounts with a year or more of data. In the shorter samples, November and December are often the account’s first months, so a comparison would mostly show how an account started, not the season.
- TACoS was lower in those months in 4 accounts and higher in 3.
- In 6 of the 7 the gap was under 2 points.
So we found no clear Christmas effect in either direction. Seven accounts is too few to rule one out.
Did TACoS fall over time?
We compared each account’s first three months in the sample with its last three, using the 11 accounts with at least six months, so the two periods don’t overlap. Pooling each period’s ad spend and sales, TACoS fell in 5 accounts and rose in 6. Total sales grew in all 5 where TACoS fell, and in 4 of the 6 where it rose. Using each period’s median month instead, one account flips, giving 6 and 5, so the split is close to even either way. So a rising TACoS did not by itself mean trouble, which fits what our guide to a good TACoS says about reading the trend. These periods also fall in different seasons, so treat this as a rough read.
All 14 accounts
Accounts are lettered in order of median TACoS. We don’t name them, their categories or their sales.
| Account | Months | Median TACoS | Lowest–highest month | Ad share of sales | ACoS | Typical monthly change |
|---|---|---|---|---|---|---|
| A | 7 | 2.6% | 1.4–17.1% | 20% | 13% | 1.4 pts |
| B | 8 | 4.7% | 2.8–7.0% | 32% | 15% | 0.6 pts |
| C | 13 | 4.9% | 2.6–7.5% | 31% | 16% | 1.1 pts |
| D | 16 | 7.4% | 4.8–10.7% | 29% | 28% | 0.9 pts |
| E | 5 | 7.5% | 6.7–7.9% | 37% | 21% | 0.7 pts |
| F | 17 | 8.3% | 6.0–12.7% | 36% | 25% | 1.0 pts |
| G | 16 | 9.4% | 7.4–13.4% | 42% | 23% | 1.0 pts |
| H | 16 | 10.3% | 7.3–14.0% | 46% | 23% | 1.0 pts |
| I | 5 | 12.7% | 9.5–16.8% | 66% | 21% | 2.1 pts |
| J | 17 | 13.9% | 10.5–19.6% | 47% | 31% | 1.2 pts |
| K | 17 | 18.9% | 14.5–23.8% | 59% | 33% | 2.4 pts |
| L | 4 | 22.1% | 18.2–36.6% | 69% | 33% | 4.5 pts |
| M | 9 | 24.4% | 7.1–35.3% | 57% | 44% | 7.1 pts |
| N | 6 | 43.1% | 11.3–81.9% | 56% | 77% | 16.1 pts |
Ad share and ACoS are each account’s median month, measured where the sheet recorded ad-attributed sales below total sales.
What this data can’t tell you
- It is 14 accounts from one agency. They are accounts we’ve managed, not a random sample of Amazon sellers.
- It mixes stages. The three accounts above 20% were launches; that comes from our knowledge of those accounts, not from the sheets. We haven’t labelled the stage of the others.
- It mixes categories and sizes, from small accounts to some of the largest we run.
- We did not remove VAT from sales. We used Ordered Product Sales as our sheets hold it, while Amazon Ads reports ad-attributed sales without VAT. Where the sales figure includes UK VAT at 20%, TACoS and ad share read up to a sixth lower than on a VAT-free basis. Compare your own figure on the same basis.
- Organic sales are an estimate. Amazon credits a sale to an ad only when a shopper clicked and bought within its attribution window, so “not credited to an ad” isn’t quite the same as “would have happened without ads”.
A benchmark is useful for one thing: telling you whether a number is unusual. In our data, 10 of the 14 accounts ran between about 5% and 19%, and the highest three were launches. Whether your own figure is good depends on your profit: your margin, your type of product and whether more of each month’s sales are arriving without an ad. This data doesn’t measure your margin.
Frequently asked questions
What is the average TACoS on Amazon?
Is a TACoS under 10% good?
Why is my TACoS above 20%?
How much does TACoS change month to month?
Does TACoS go up at Christmas?
Can I use these figures?
Sources
- Amazon advertising benchmarks 2026. Sequence Commerce, 29 June 2026, updated 27 October 2026. Checked 31 October 2026.
- Average Amazon TACOS benchmarks by category (2026). Eightx, 30 June 2026. Checked 4 November 2026.
How this guide was made
Written by Robert Prime and reviewed by Stephen Harrison at Mr. Prime, which runs Amazon accounts for UK brands. We used AI tools to help research and draft it; Robert edited it and takes responsibility for it. Every figure was recomputed on 31 October 2026 from the monthly sales and advertising sheets we keep for each account, by a script that prints every month it leaves out and why. The two published benchmarks we compare against were read on their own pages that day, and Eightx’s again on 4 November.
Every figure above links to the primary source it came from, and we recheck them when Amazon changes its fees or definitions. Read our editorial standards. Spotted something wrong? Tell us through our contact page and we will correct it and note the change here.
About the author
Robert Prime
Robert has spent more than two decades building, growing and selling online businesses, including an Amazon brand he built and sold for seven figures.
His other exits include Telematics.com, sold to LexisNexis, and Remortgage.com. He co-owned UpDownDesk.com.au, growing it on Shopify alone from £12k to £350k a month before he exited, one of more than six Shopify businesses he has built and sold.
He sets and reviews the strategy for every Mr. Prime client, with the view of an operator who has sat on your side of the table.
Reviewed by
Stephen Harrison
Fourteen years a police officer, then his own Amazon brands. Now runs more client accounts than anyone, meticulously.
Your numbers, not ours
See your own break-even, TACoS and profit after ads.
The Profit X-Ray works it out from four monthly figures, or from your Business Report, in your browser.